RESULTS
Some results of the application of the game with architecture students of the Federal University of Rio Grande do Sul. Since there were many students, classes were divided into Factories, and which factory was responsible for applying all Production Modes. Tables and graphs refer to times in seconds for the construction of the houses in each Production Mode.
Semester:
2013/1
-

- 2013.1 Table (The numbers refer to time – in seconds -needed to complete each round)
-
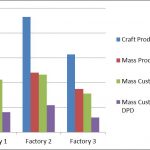
- 2013.1 (The numbers refer to time – in seconds -needed to complete each round)
2014/1
-

- 2014.1 Table (The numbers refer to time – in seconds -needed to complete each round)
-
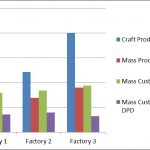
- 2014.1 (The numbers refer to time – in seconds -needed to complete each round)
2016/1
-

- 2016.1 Table (The numbers refer to time – in seconds -needed to complete each round)
-
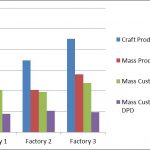
- 2016.1 (The numbers refer to time – in seconds -needed to complete each round)
2016/2
-
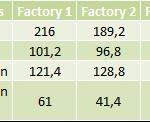
- 2016.2 Table (The numbers refer to time – in seconds -needed to complete each round)
-
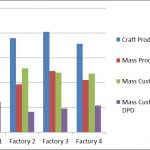
- 2016.2 (The numbers refer to time – in seconds -needed to complete each round)
2017/1
-

- 2017.1 Table (The numbers refer to time – in seconds -needed to complete each round)
-
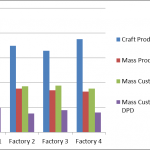
- 2017.1 (The numbers refer to time – in seconds -needed to complete each round)
2017/2
-

- 2017.2 Table (The numbers refer to time – in seconds -needed to complete each round)
-

- 2017.2 (The numbers refer to time – in seconds -needed to complete each round)
2018/1
-

- 2018.1 Table (The numbers refer to time – in seconds -needed to complete each round)
-

- 2018.1 (The numbers refer to time – in seconds -needed to complete each round)
2018/2
-

- 2018.2 Table (The numbers refer to time – in seconds -needed to complete each round)
-

- 2018.2 (The numbers refer to time – in seconds -needed to complete each round)
2019/1
-

- 2019.1 Table (The numbers refer to time – in seconds -needed to complete each round)
-

- 2019.1 (The numbers refer to time – in seconds -needed to complete each round)
Compilation of Results
-

- General Table (The numbers refer to the average time – in seconds -needed to complete each round)
-

- General Graph 1 (The numbers refer to the average time – in seconds -needed to complete each round)
-

- General Graph 2 (The numbers refer to the average time – in seconds -needed to complete each round)
EVALUATION QUESTIONNAIRES
The game is then followed by the application two questionnaires to assess the impact of the game on students learning. The learning intended by game is two-folded: (i) understand differences of the four production modes in terms of product variety and production efficiency and (ii) understand the MC enablers and how they overcome the trade-off between product variety and production efficiency.
Open-ended questionnaire
In the first section of the questionnaire, students are required to write down the average production lead time and product variety of each production mode. Production lead time (proxy for production efficiency) for each production mode is spelled out by the manager based on the average lead time of the five orders according to the time recorded by supervisor in Workstations A, B, and C. Product variety is individually assessed by each player based on the four sheets of paper containing the orders produced under each production mode. The second section of the questionnaire contains three questions (Q1, Q2, and Q3) to assess students’ learning.

Open-ended questionnaire
Close-ended questionnaire
Approximately two months after the game application, a second questionnaire can be administered to students. It contains the same questions of the first questionnaire, but presented in a close-ended format. This second questionnaire has two main goals. First, assess the understanding of MC enablers and production modes in the long term. Second, provide a more objective measurement of students’ understanding of the MC enablers than the open-ended questionnaire.

Close-ended questionnaire
Results
The questionnaires have been applied to the students who have played the game. Since 2012, only two classes answered both questionnaires (2012/2 and 2014/1). Most classes only answered the open-ended questionnaire. A decimal value from 0 to 1 on the graphics shows the amount of correct answers.

Correct Answers
-

- 2012.2 Results
-

- 2013.1 Results
-

- 2013.2 Results
-

- 2014.1 Results
-

- 2014.2 Results
-

- Average Results for 2012.2 and 2014.1
-

- 2017.1 Results
-

- 2017.2 Results
-

- 2018.1 Results
-

- 2018.2 Results
-

- 2019.1 Results