Autophagy
Acridine orange staining and quantification by flow cytometry
This is the standard protocol used for the preparation of adherent culture cells used for flow cytometric analysis in this paper.
This information is intended as a guide and may need to be optimized for particular cell types or flow cytometer equipment.
Sample Preparation
- Prepare a 500 µg/mL stock solution of Acridine orange in ddH2O, store at 4°C and protect from direct light. Perform the staining procedures in subdued light.
- Grow cells on the desired cell culture plate and induce the cells according to your specific protocol.
- Prepare the AO staining solution by diluting the stock solution in pre-warmed culture medium (AO medium) to a concentration of 1.5 µg/mL. Prepare it immediately prior to use.
- Harvest the cells by enzymatic release and dissociate cell aggregates.
- Add the medium with AO in the proportion 2:1 (AO medium:enzymatic solution) to a final concentration of 1 µg/mL AO. Resuspend the cells by gently pipetting. All samples should be prepared in a single-cell suspension and transferred to the tube/dish for flow cytometry acquisition.
- Incubate the cells for 15 min at room temperature in the dark and proceed with acquisition on the flow cytometer.
Acquisition
-
Plot a two-parameter dot-plot of Forward Scatter (FSC) vs Side Scatter (SSC) and continue with standard procedures to gate out debris and doublets.
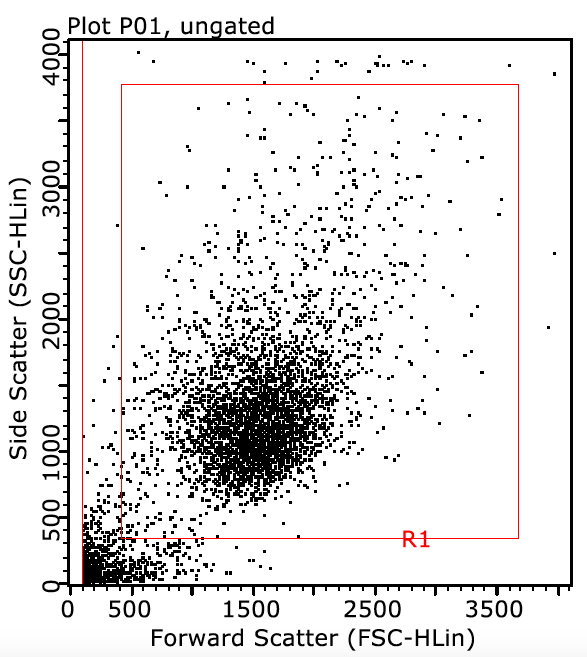
FSC versus SSC plot for gating debris and doublets.
-
Plot a two-parameter dot-plot with logarithmic scale to gate out unstained cells. Select the appropriate bandpass filters, according to Figure 1 of the manuscript, to detect red fluorescence (y-axis) and green fluorescence (x-axis).
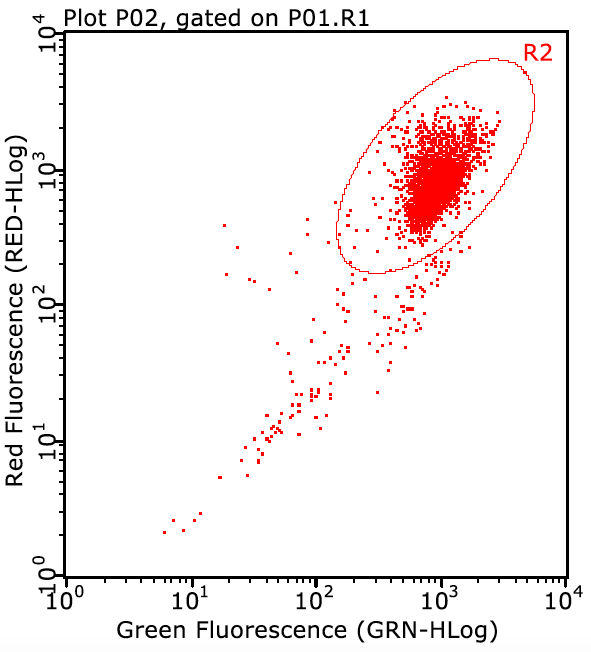
Logarithmic fluorescence plot for identification of unstained cells.
-
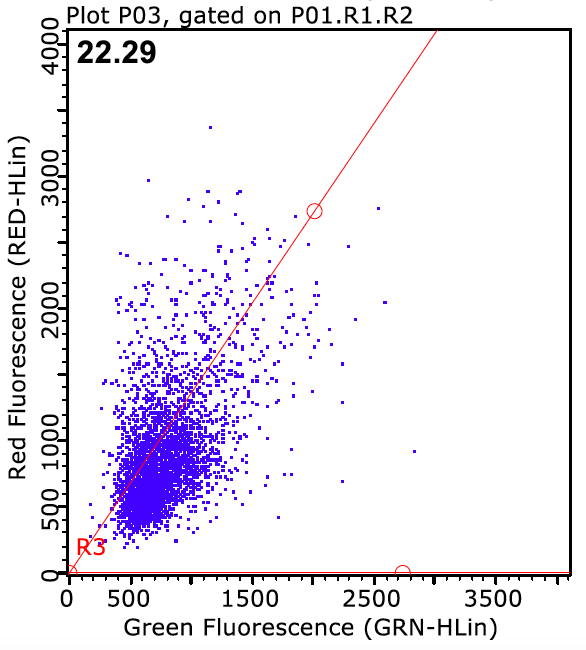
Plot a two-parameter dot-plot with linear scale to detect red fluorescence (y-axis) and green fluorescence (x-axis).
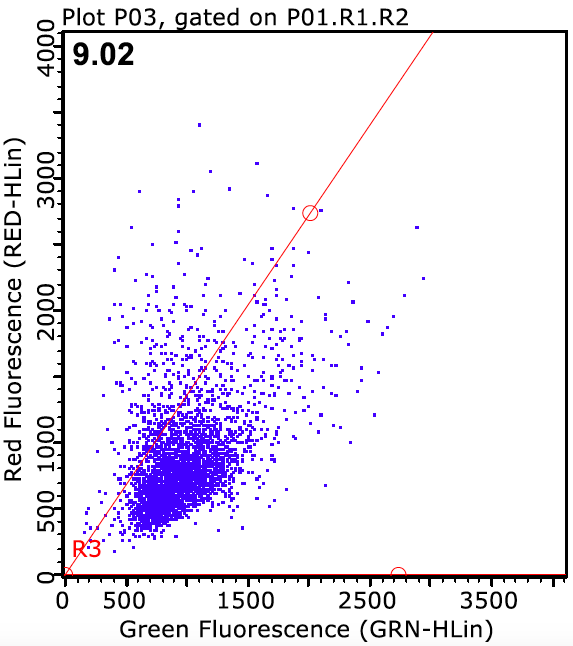
Linear-scale red and green fluorescence plot.
-
Introduce the sample and set the machine to “run”. Using the appropriate setting panel, adjust FSC and SSC photomultiplier tube voltages so that the majority of dots in the first two-parameter dot-plot are contained roughly within the center of the plot.
-
Adjust the red and green fluorescence detector voltages up or down. The voltage can then be fine-tuned so that, in the log-scale plot, intensities are between 102 and 103. Fine-tune the voltages so that, in the linear-scale plot, the events are positioned as represented in the figures in the paper.
-
After setting up the machine, collect at least 5,000 gated events.
Analysis
1. Percentage of events above a defined threshold
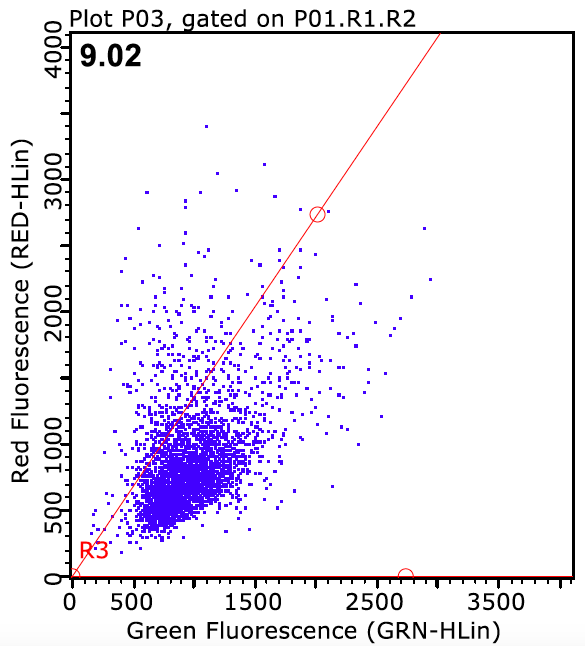
- Repeat steps 1–3 from acquisition. In the linear-scale dot-plot, set an R/GFIR-based threshold (R/GFIR-BT) along the population axis, so that the red-to-green fluorescence ratio is considered. This may be determined by a linear equation y = ax + b, where the slope (a) can be set according to the population distribution.
- For the control group, delimit a positive population above the threshold from 5–10%. Using the same threshold setting, analyze the other samples. The proportion of cells above the selected threshold can be reported as fold change relative to control.
2. Red-to-green fluorescence intensity ratio
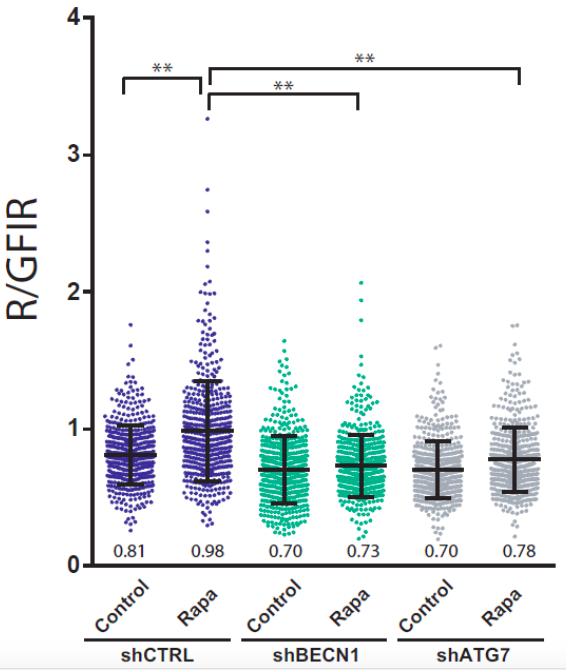
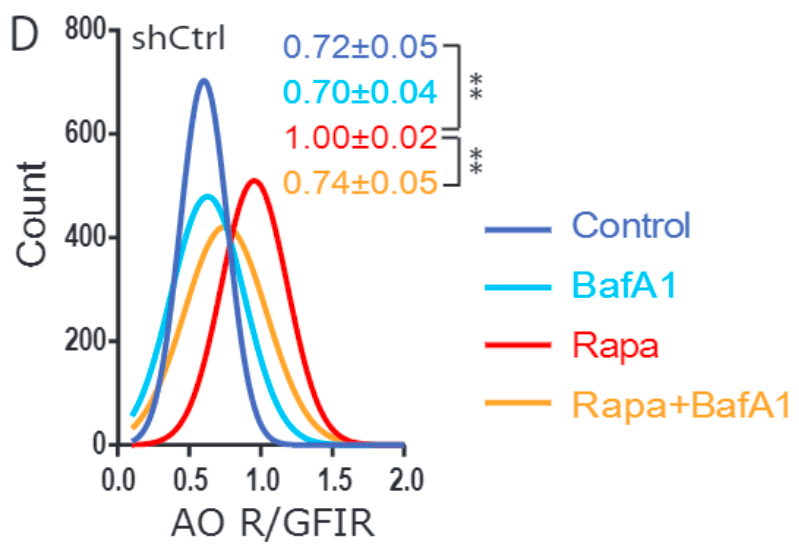
It is possible to analyze each parameter (FSC, SSC, red and green fluorescence intensity) of individual events. These data can be exported, tabulated and analyzed in a suitable presentation package, for example, Excel or Prism. The manner in which these data are extracted may differ between software.
CITATION
Thome, M.P., Filippi-Chiela, E.C., Villodre, E.S. et al. Ratiometric analysis of acridine orange staining in cells.


Related Links
Programa de Pós-Graduação em Biologia Celular e Molecular — UFRGS
Find Us
Instituto Biociências - Dep. Biofísica
Prédio 43431, Sala 115
Avenida Bento Gonçalves, 9500 — Bloco IV
Porto Alegre, 91509-900, Brazil
© LabSinal 2016–2026.
Porto Alegre · Brazil